The elevation of everywhere, in interactive 3D.
The lowest dry land on Earth is the shore of the Dead Sea, 440 metres below sea level. The highest is the summit of Mount Everest, 8,849 metres up. Between those two extremes most of the planet is surprisingly low — the average land elevation is about 801 metres, and half of all land sits below 426 metres.
This site maps that relief in true 3D for every place on Earth: 252 so far — every country, all 50 US states, the seven continents, and the whole planet. Grab any one, tilt and spin it, and read the elevation at any point. Each map also gives you the highest and lowest points, the mean and median elevation, and how the land is split across height bands.
The data is real, not decorative. Every map is built from the Copernicus GLO-30 model — a satellite elevation dataset that samples the surface roughly every 30 metres — and rendered as actual terrain, not a flat map shaded by colour. A colour map tells you where the mountains are; a 3D elevation model shows how high they stand, how steeply they rise, and how the land sits between them: the plateau a country’s cities are built on, the trench of a rift valley, the wall of a coastal range.
- places mapped
- 252 places mapped
- countries
- 194 countries
- US states
- 50 US states
- continents
- 7 continents
Countries
Every country, rendered from satellite data
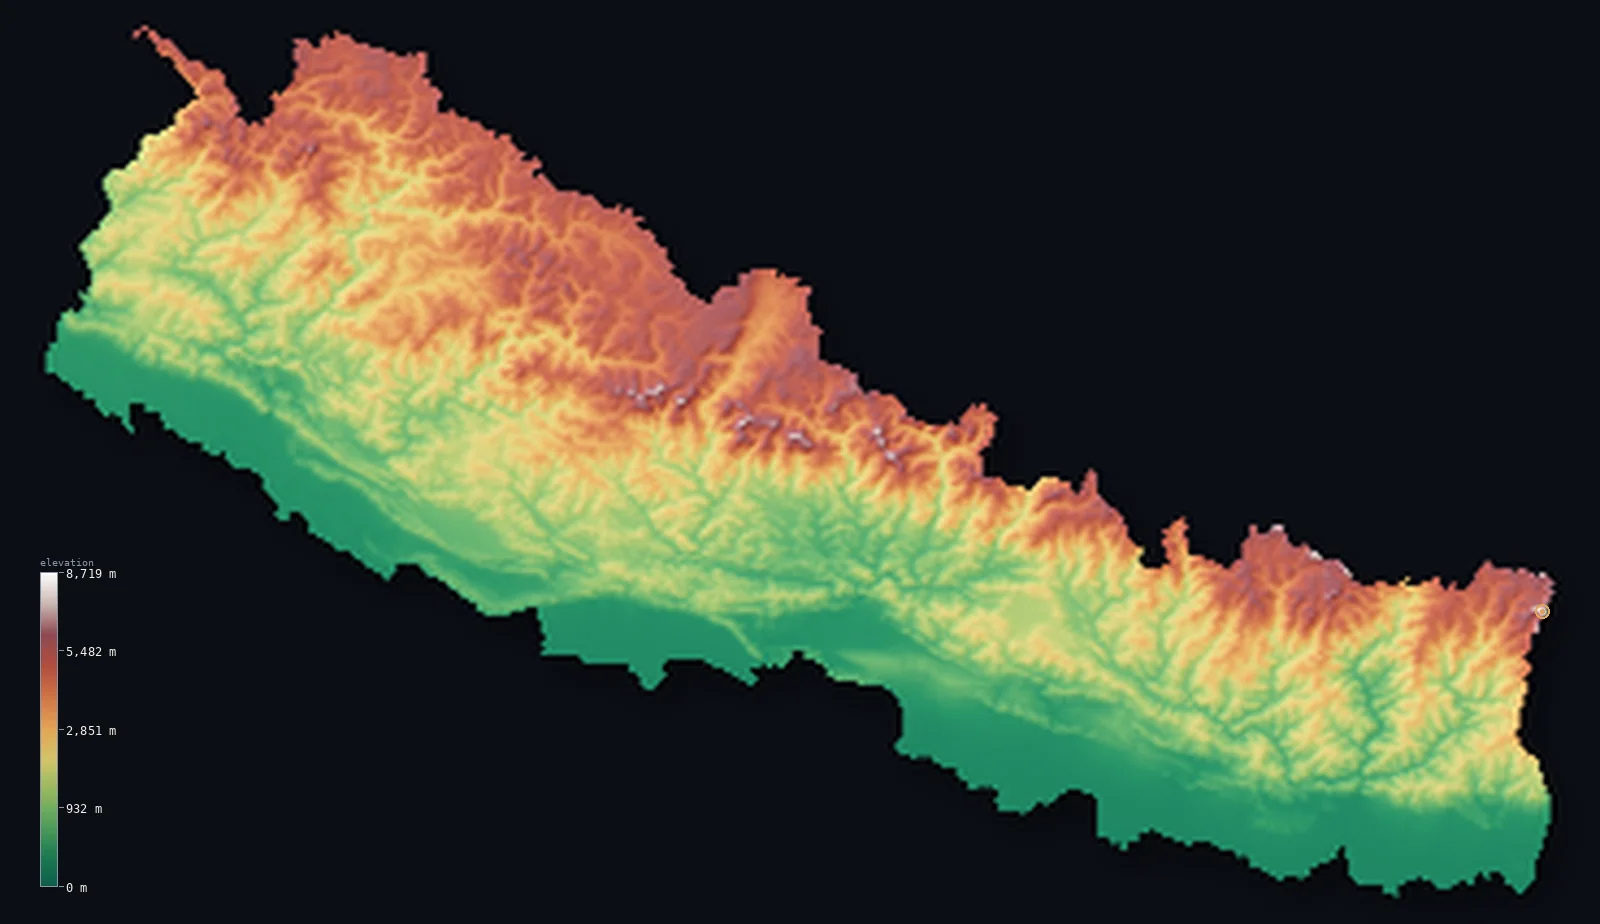
Every country is masked to its official boundary and rendered from the same satellite model, so the terrain is comparable everywhere — the Andean spine of Chile, the Himalaya along Nepal’s northern border, the near-flat delta coasts. Open any country to spin its relief and read its high and low points, mean elevation, and the share of its area above each height.
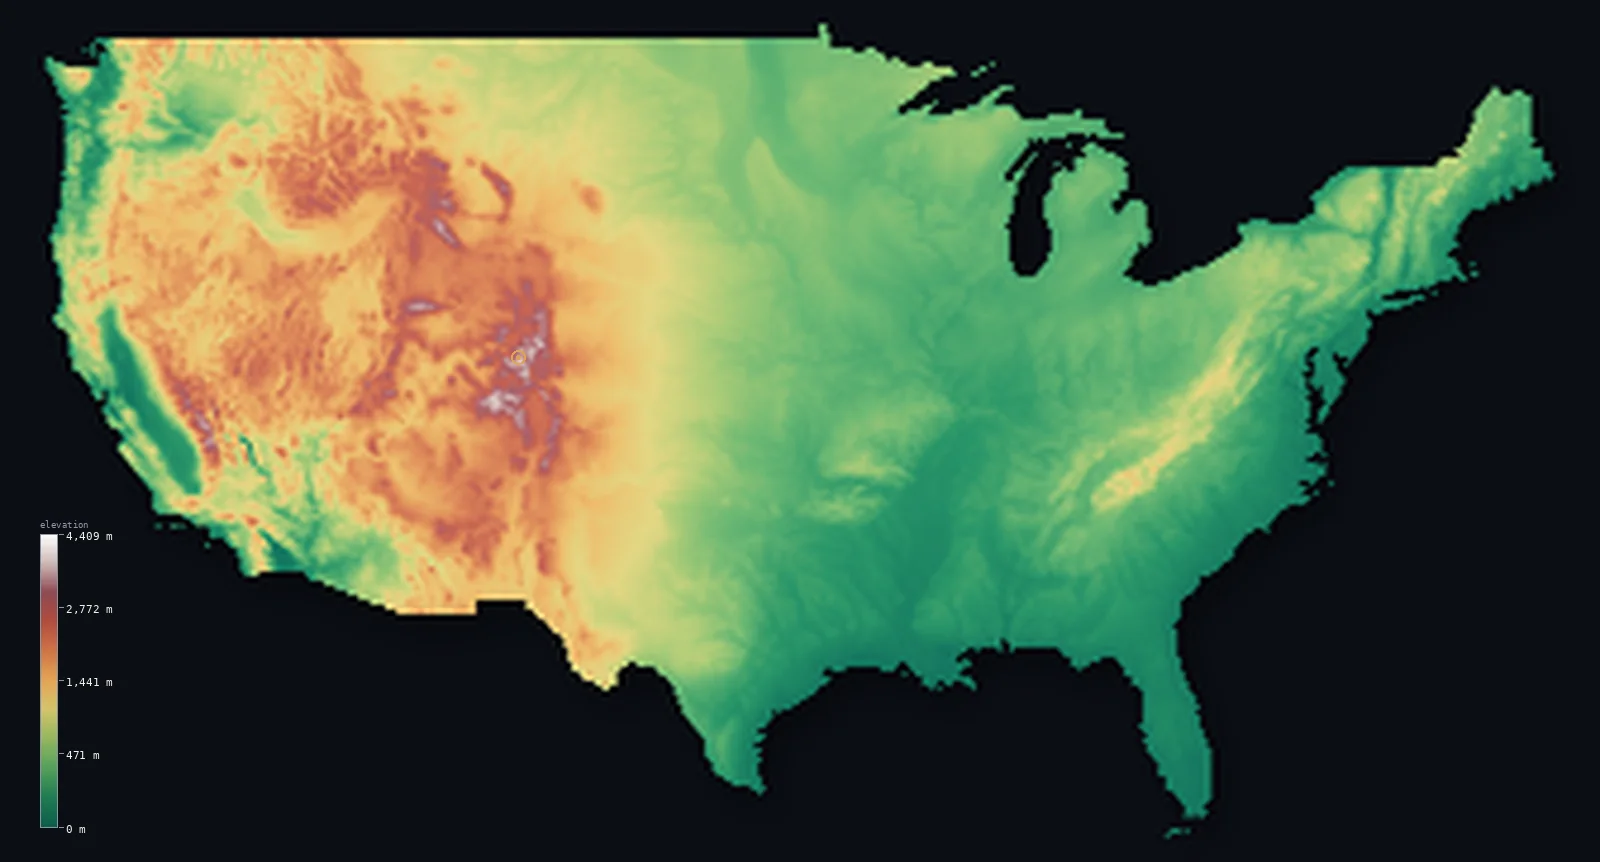
Highest point Denali, 6,190 m
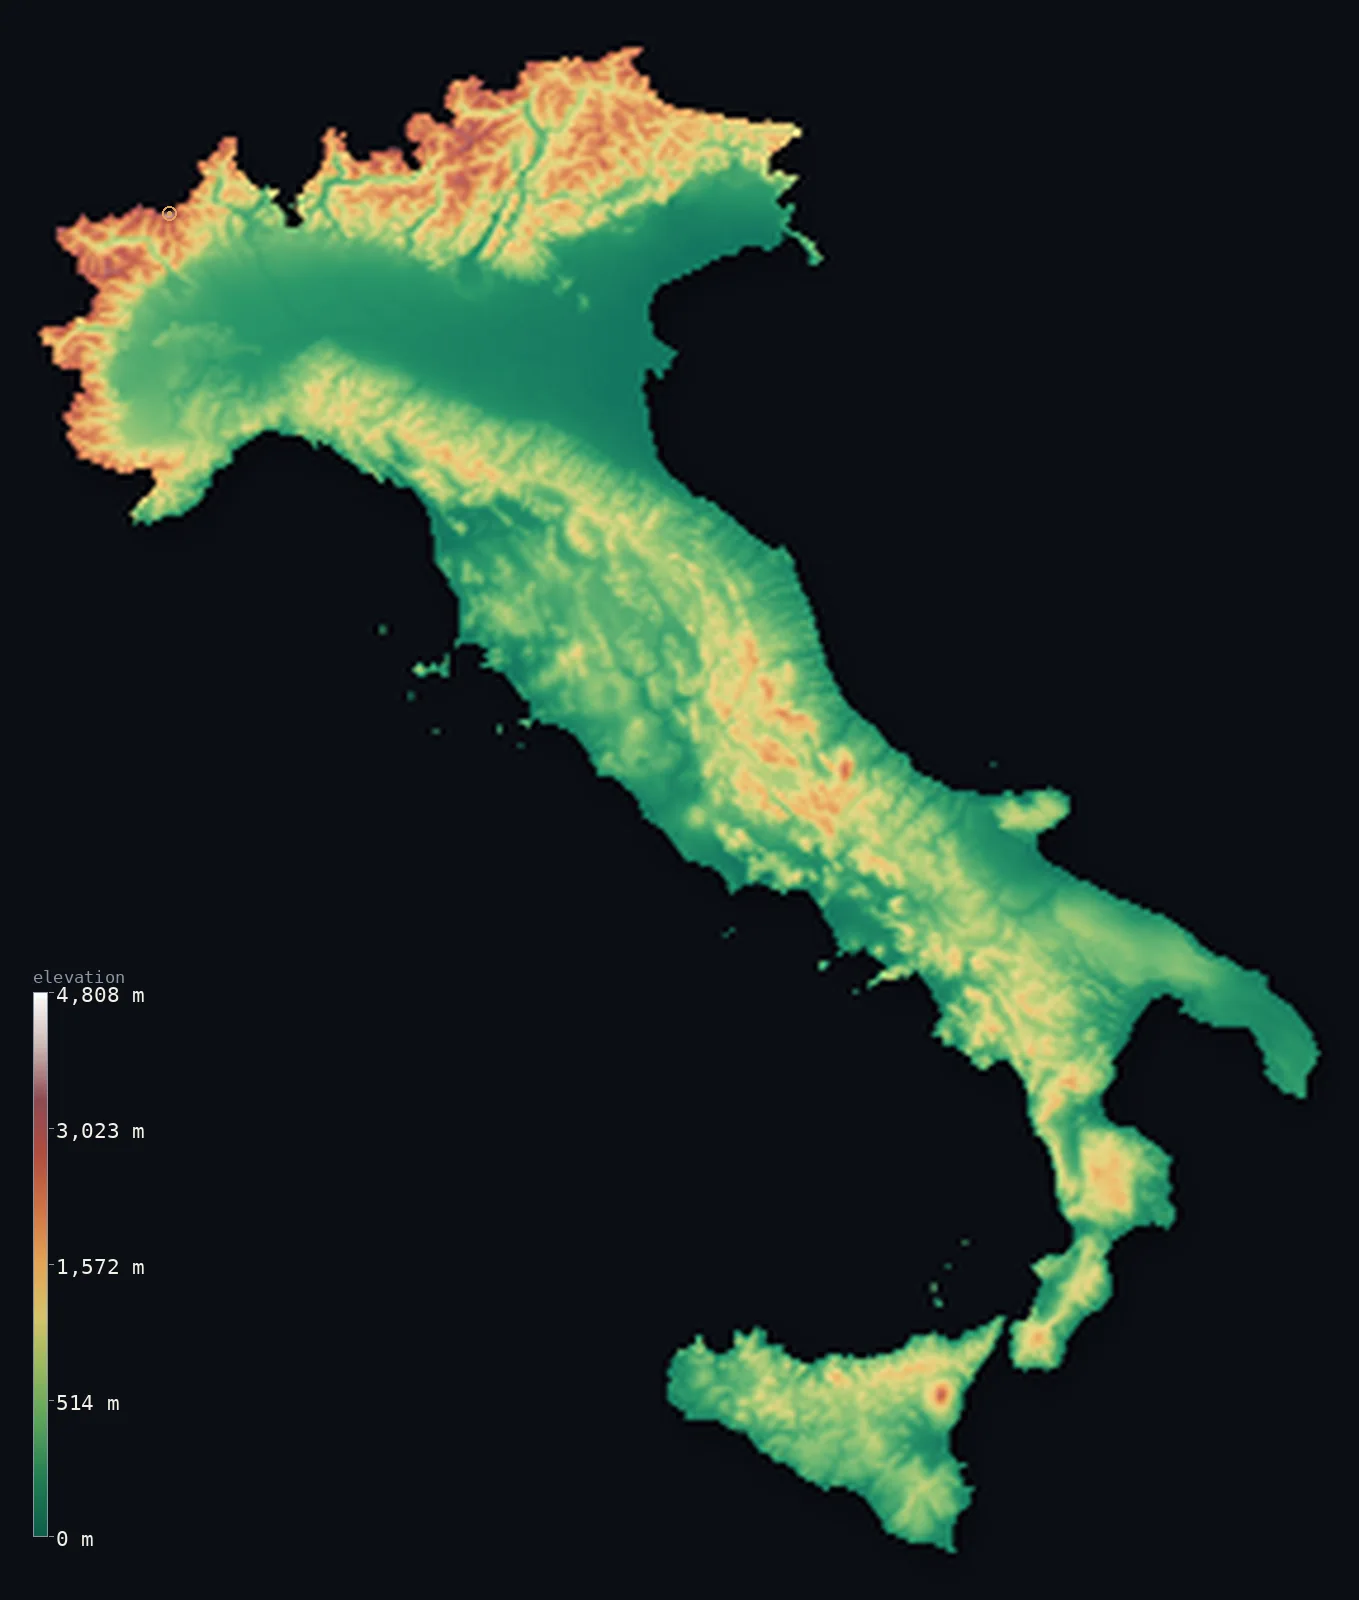
Highest point Monte Bianco (Mont Blanc), 4,806 m
Dramatic terrain to start with
- Nepal
A dramatic 28,802 ft (8,779 m) of relief separates Kanchan Kalan from Mount Everest (Sagarmatha). Even its typical ground is high — half the country lies above 5,197 ft (1,584 m).
- Highest
- Mount Everest (Sagarmatha) · 29,032 ft (8,849 m)
- Lowest
- Kanchan Kalan · 230 ft (70 m)
- Mean
- 6,929 ft (2,112 m)
- · Median
- 5,197 ft (1,584 m)
- Chile
A dramatic 22,615 ft (6,893 m) of relief separates the Pacific Ocean coast from Ojos del Salado. Most of it lies far lower, though — half the land sits below 2,769 ft (844 m).
- Highest
- Ojos del Salado · 22,615 ft (6,893 m)
- Lowest
- Pacific Ocean coast · sea level
- Mean
- 4,341 ft (1,323 m)
- · Median
- 2,769 ft (844 m)
- Switzerland
A dramatic 14,570 ft (4,441 m) of relief separates Lake Maggiore from Dufourspitze (Monte Rosa). Half its land lies below 3,576 ft (1,090 m).
- Highest
- Dufourspitze (Monte Rosa) · 15,203 ft (4,634 m)
- Lowest
- Lake Maggiore · 633 ft (193 m)
- Mean
- 4,301 ft (1,311 m)
- · Median
- 3,576 ft (1,090 m)
- Iceland
Its land ranges 6,923 ft (2,110 m), from the Atlantic Ocean coast up to Hvannadalshnúkur. Half its land lies below 1,555 ft (474 m).
- Highest
- Hvannadalshnúkur · 6,923 ft (2,110 m)
- Lowest
- Atlantic Ocean coast · sea level
- Mean
- 1,657 ft (505 m)
- · Median
- 1,555 ft (474 m)
- Norway
Its land ranges 8,100 ft (2,469 m), from the Norwegian Sea up to Galdhopiggen. Half its land lies below 1,568 ft (478 m).
- Highest
- Galdhopiggen · 8,100 ft (2,469 m)
- Lowest
- Norwegian Sea · sea level
- Mean
- 1,831 ft (558 m)
- · Median
- 1,568 ft (478 m)
- Japan
Its land ranges 12,402 ft (3,780 m), from Hachirōgata up to Mount Fuji (Fujisan). Its lowest ground, Hachirōgata, lies 13 ft (4 m) below sea level.
- Highest
- Mount Fuji (Fujisan) · 12,388 ft (3,776 m)
- Lowest
- Hachirōgata · 13 ft (4 m) below sea
- Mean
- 1,299 ft (396 m)
- · Median
- 928 ft (283 m)
- New Zealand
Its land ranges 12,218 ft (3,724 m), from the Pacific Ocean coast up to Aoraki / Mount Cook. Half its land lies below 1,168 ft (356 m).
- Highest
- Aoraki / Mount Cook · 12,218 ft (3,724 m)
- Lowest
- Pacific Ocean coast · sea level
- Mean
- 1,608 ft (490 m)
- · Median
- 1,168 ft (356 m)
- Peru
A dramatic 22,205 ft (6,768 m) of relief separates the Pacific Ocean from Huascaran. Most of it lies far lower, though — half the land sits below 1,509 ft (460 m).
- Highest
- Huascaran · 22,205 ft (6,768 m)
- Lowest
- Pacific Ocean · sea level
- Mean
- 4,810 ft (1,466 m)
- · Median
- 1,509 ft (460 m)
- Bhutan
A dramatic 24,518 ft (7,473 m) of relief separates Drangme Chhu (river) from Gangkhar Puensum. Even its typical ground is high — half the country lies above 9,173 ft (2,796 m).
- Highest
- Gangkhar Puensum · 24,836 ft (7,570 m)
- Lowest
- Drangme Chhu (river) · 318 ft (97 m)
- Mean
- 9,354 ft (2,851 m)
- · Median
- 9,173 ft (2,796 m)
- Italy
A dramatic 15,768 ft (4,806 m) of relief separates the Mediterranean Sea from Monte Bianco (Mont Blanc). Most of it lies far lower, though — half the land sits below 1,132 ft (345 m).
- Highest
- Monte Bianco (Mont Blanc) · 15,768 ft (4,806 m)
- Lowest
- Mediterranean Sea · sea level
- Mean
- 1,814 ft (553 m)
- · Median
- 1,132 ft (345 m)
- Georgia
A dramatic 17,037 ft (5,193 m) of relief separates the Black Sea from Shkhara. Half its land lies below 3,743 ft (1,141 m).
- Highest
- Shkhara · 17,037 ft (5,193 m)
- Lowest
- Black Sea · sea level
- Mean
- 4,045 ft (1,233 m)
- · Median
- 3,743 ft (1,141 m)
- Tajikistan
A dramatic 23,606 ft (7,195 m) of relief separates Syr Darya from Ismoil Somoni Peak. Even its typical ground is high — half the country lies above 10,883 ft (3,317 m).
- Highest
- Ismoil Somoni Peak · 24,590 ft (7,495 m)
- Lowest
- Syr Darya · 984 ft (300 m)
- Mean
- 9,688 ft (2,953 m)
- · Median
- 10,883 ft (3,317 m)
- Afghanistan
A dramatic 23,734 ft (7,234 m) of relief separates the Amu Darya river from Noshaq. Even its typical ground is high — half the country lies above 5,177 ft (1,578 m).
- Highest
- Noshaq · 24,580 ft (7,492 m)
- Lowest
- Amu Darya river · 846 ft (258 m)
- Mean
- 5,906 ft (1,800 m)
- · Median
- 5,177 ft (1,578 m)
- Kyrgyzstan
A dramatic 23,973 ft (7,307 m) of relief separates Kara-Darya valley (Fergana) from Jengish Chokusu (Victory Peak). Even its typical ground is high — half the country lies above 8,940 ft (2,725 m).
- Highest
- Jengish Chokusu (Victory Peak) · 24,406 ft (7,439 m)
- Lowest
- Kara-Darya valley (Fergana) · 433 ft (132 m)
- Mean
- 8,655 ft (2,638 m)
- · Median
- 8,940 ft (2,725 m)
- Ethiopia
A dramatic 15,338 ft (4,675 m) of relief separates the Danakil Depression (Afar) from Ras Dashen. Its lowest ground, the Danakil Depression (Afar), lies 410 ft (125 m) below sea level.
- Highest
- Ras Dashen · 14,928 ft (4,550 m)
- Lowest
- Danakil Depression (Afar) · 410 ft (125 m) below sea
- Mean
- 4,111 ft (1,253 m)
- · Median
- 3,750 ft (1,143 m)
- Morocco
A dramatic 13,852 ft (4,222 m) of relief separates Sebkha Tah from Jbel Toubkal. Its lowest ground, Sebkha Tah, lies 180 ft (55 m) below sea level.
- Highest
- Jbel Toubkal · 13,671 ft (4,167 m)
- Lowest
- Sebkha Tah · 180 ft (55 m) below sea
- Mean
- 2,060 ft (628 m)
- · Median
- 1,355 ft (413 m)
- Austria
Its land ranges 12,083 ft (3,683 m), from Neusiedler See up to Grossglockner. Half its land lies below 2,507 ft (764 m).
- Highest
- Grossglockner · 12,461 ft (3,798 m)
- Lowest
- Neusiedler See · 377 ft (115 m)
- Mean
- 3,127 ft (953 m)
- · Median
- 2,507 ft (764 m)
- Papua New Guinea
A dramatic 14,793 ft (4,509 m) of relief separates the Pacific Ocean from Mount Wilhelm. Most of it lies far lower, though — half the land sits below 646 ft (197 m).
- Highest
- Mount Wilhelm · 14,793 ft (4,509 m)
- Lowest
- Pacific Ocean · sea level
- Mean
- 2,113 ft (644 m)
- · Median
- 646 ft (197 m)
- Slovenia
Its land ranges 9,396 ft (2,864 m), from the Adriatic Sea coast up to Triglav. Half its land lies below 1,575 ft (480 m).
- Highest
- Triglav · 9,396 ft (2,864 m)
- Lowest
- Adriatic Sea coast · sea level
- Mean
- 1,860 ft (567 m)
- · Median
- 1,575 ft (480 m)
- Argentina
A dramatic 23,182 ft (7,066 m) of relief separates Laguna del Carbon from Cerro Aconcagua. Its lowest ground, Laguna del Carbon, lies 344 ft (105 m) below sea level.
- Highest
- Cerro Aconcagua · 22,838 ft (6,961 m)
- Lowest
- Laguna del Carbon · 344 ft (105 m) below sea
- Mean
- 2,323 ft (708 m)
- · Median
- 899 ft (274 m)
Continents & the world
Zoom out to a whole continent — or the entire planet
Zoom out and the same data assembles into whole continents and the entire planet. A continent view shows how ranges connect across borders and where the great lowlands and plateaus lie; the world map draws every landmass at once, which is where the big pattern is clear — most of Earth’s land is low, with the high ground gathered into a few mountain belts.
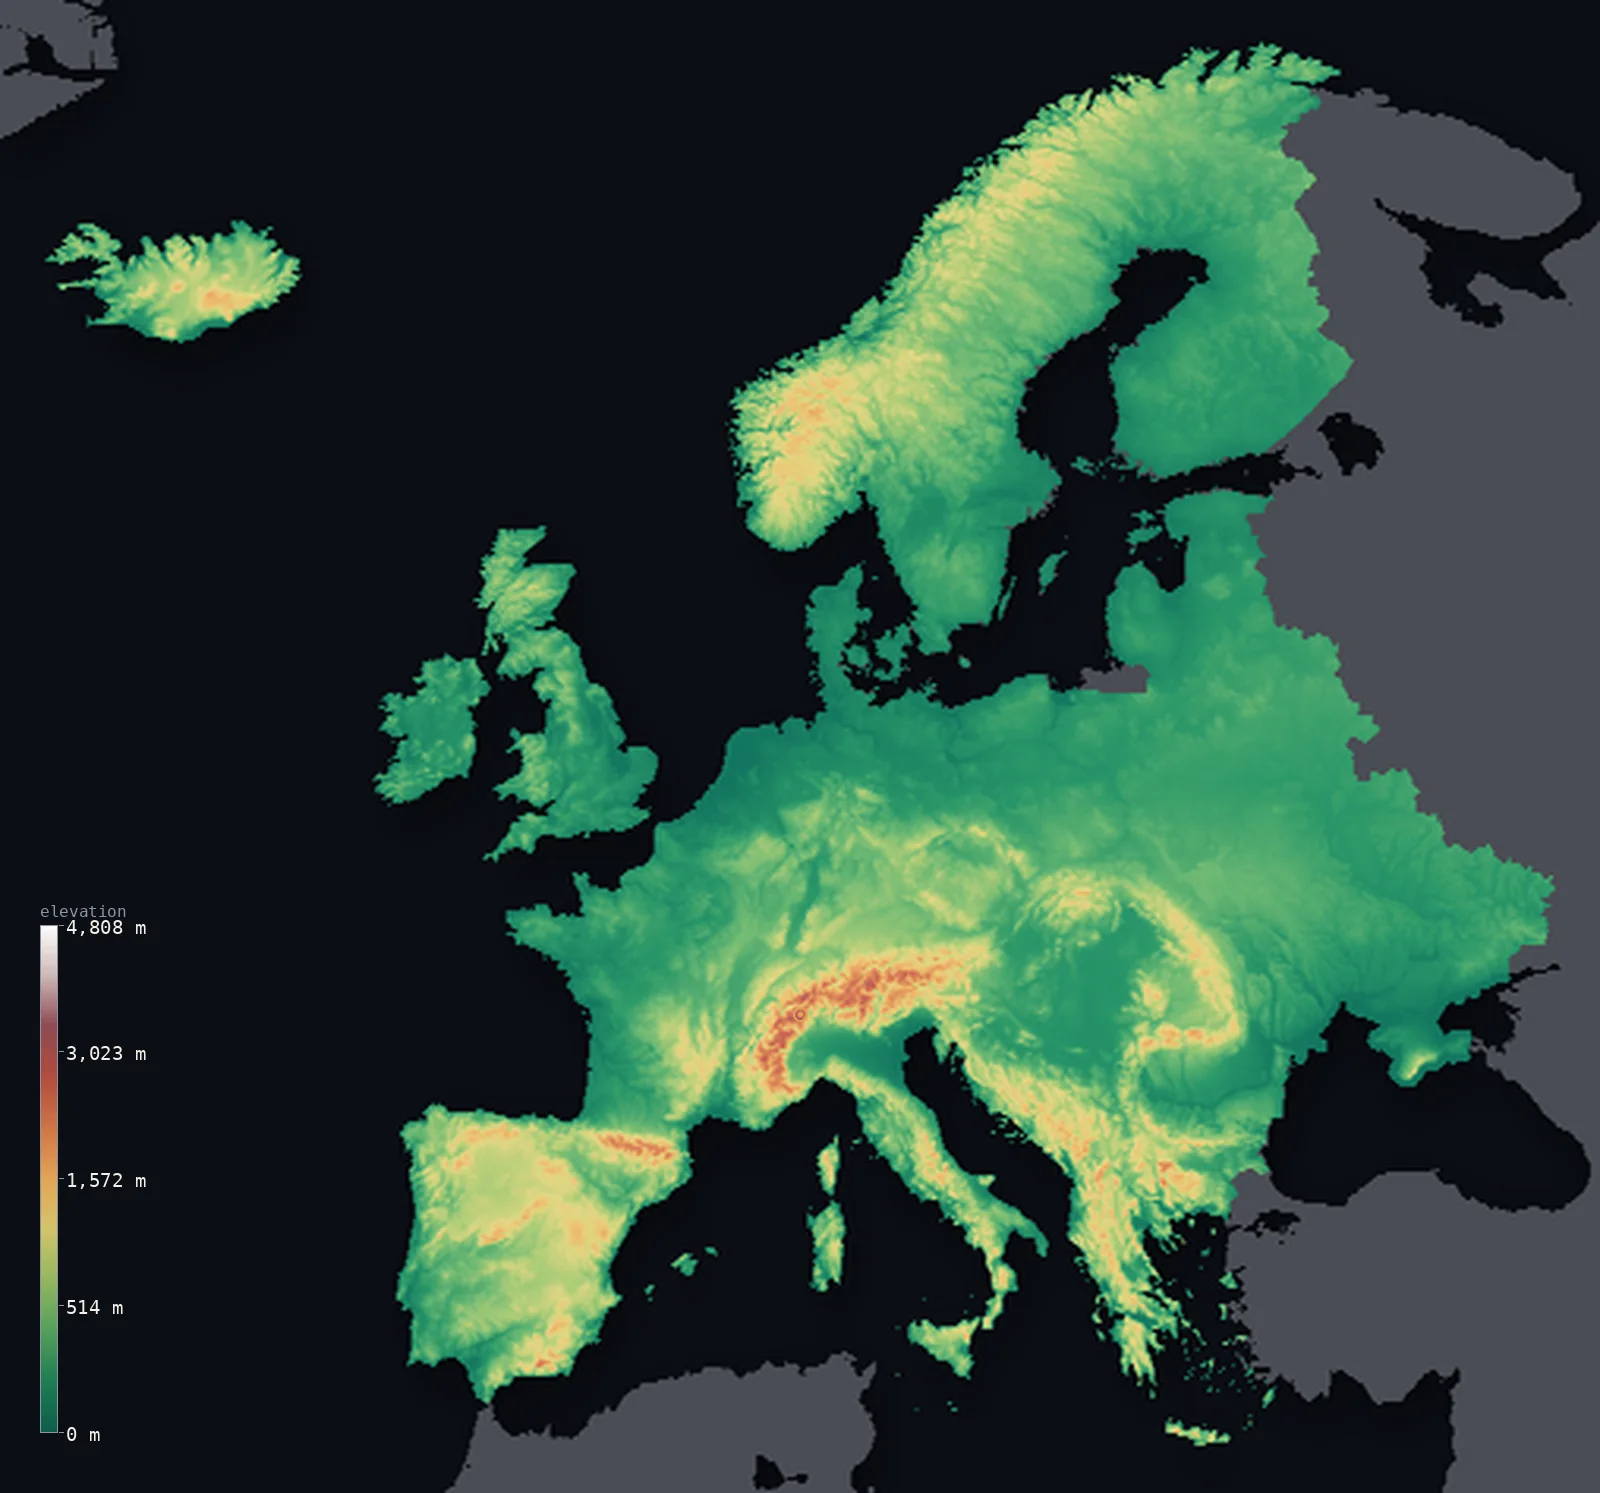
Highest point Mont Blanc, 4,810 m
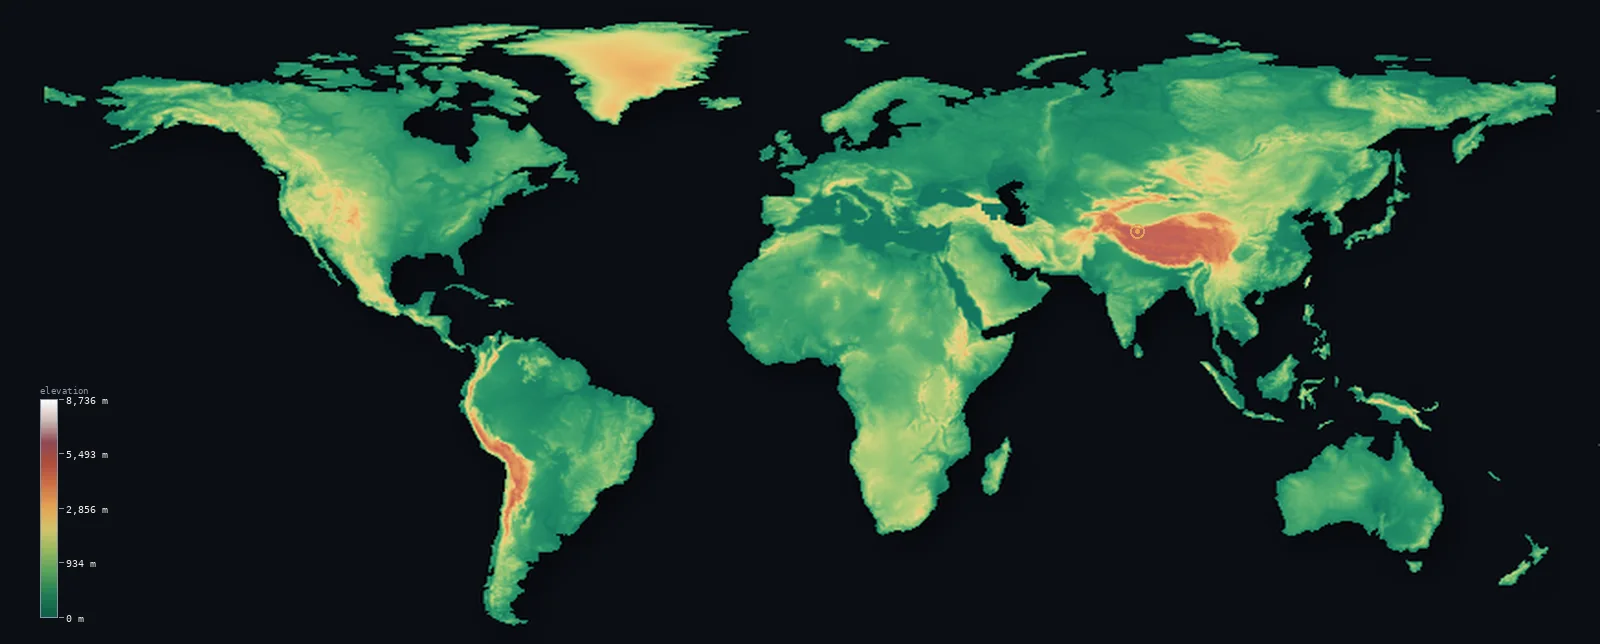
Highest point Mount Everest, 8,849 m
All 7 continents
US states
All 50 US states in 3D
The 50 US states cover most of the range of North American terrain — the Florida peninsula that barely clears sea level, the Sierra Nevada and Rockies, the long tilt of the Great Plains, the worn Appalachians. Each state is built the same way as a country, so you can read its high and low points and see its relief in 3D.
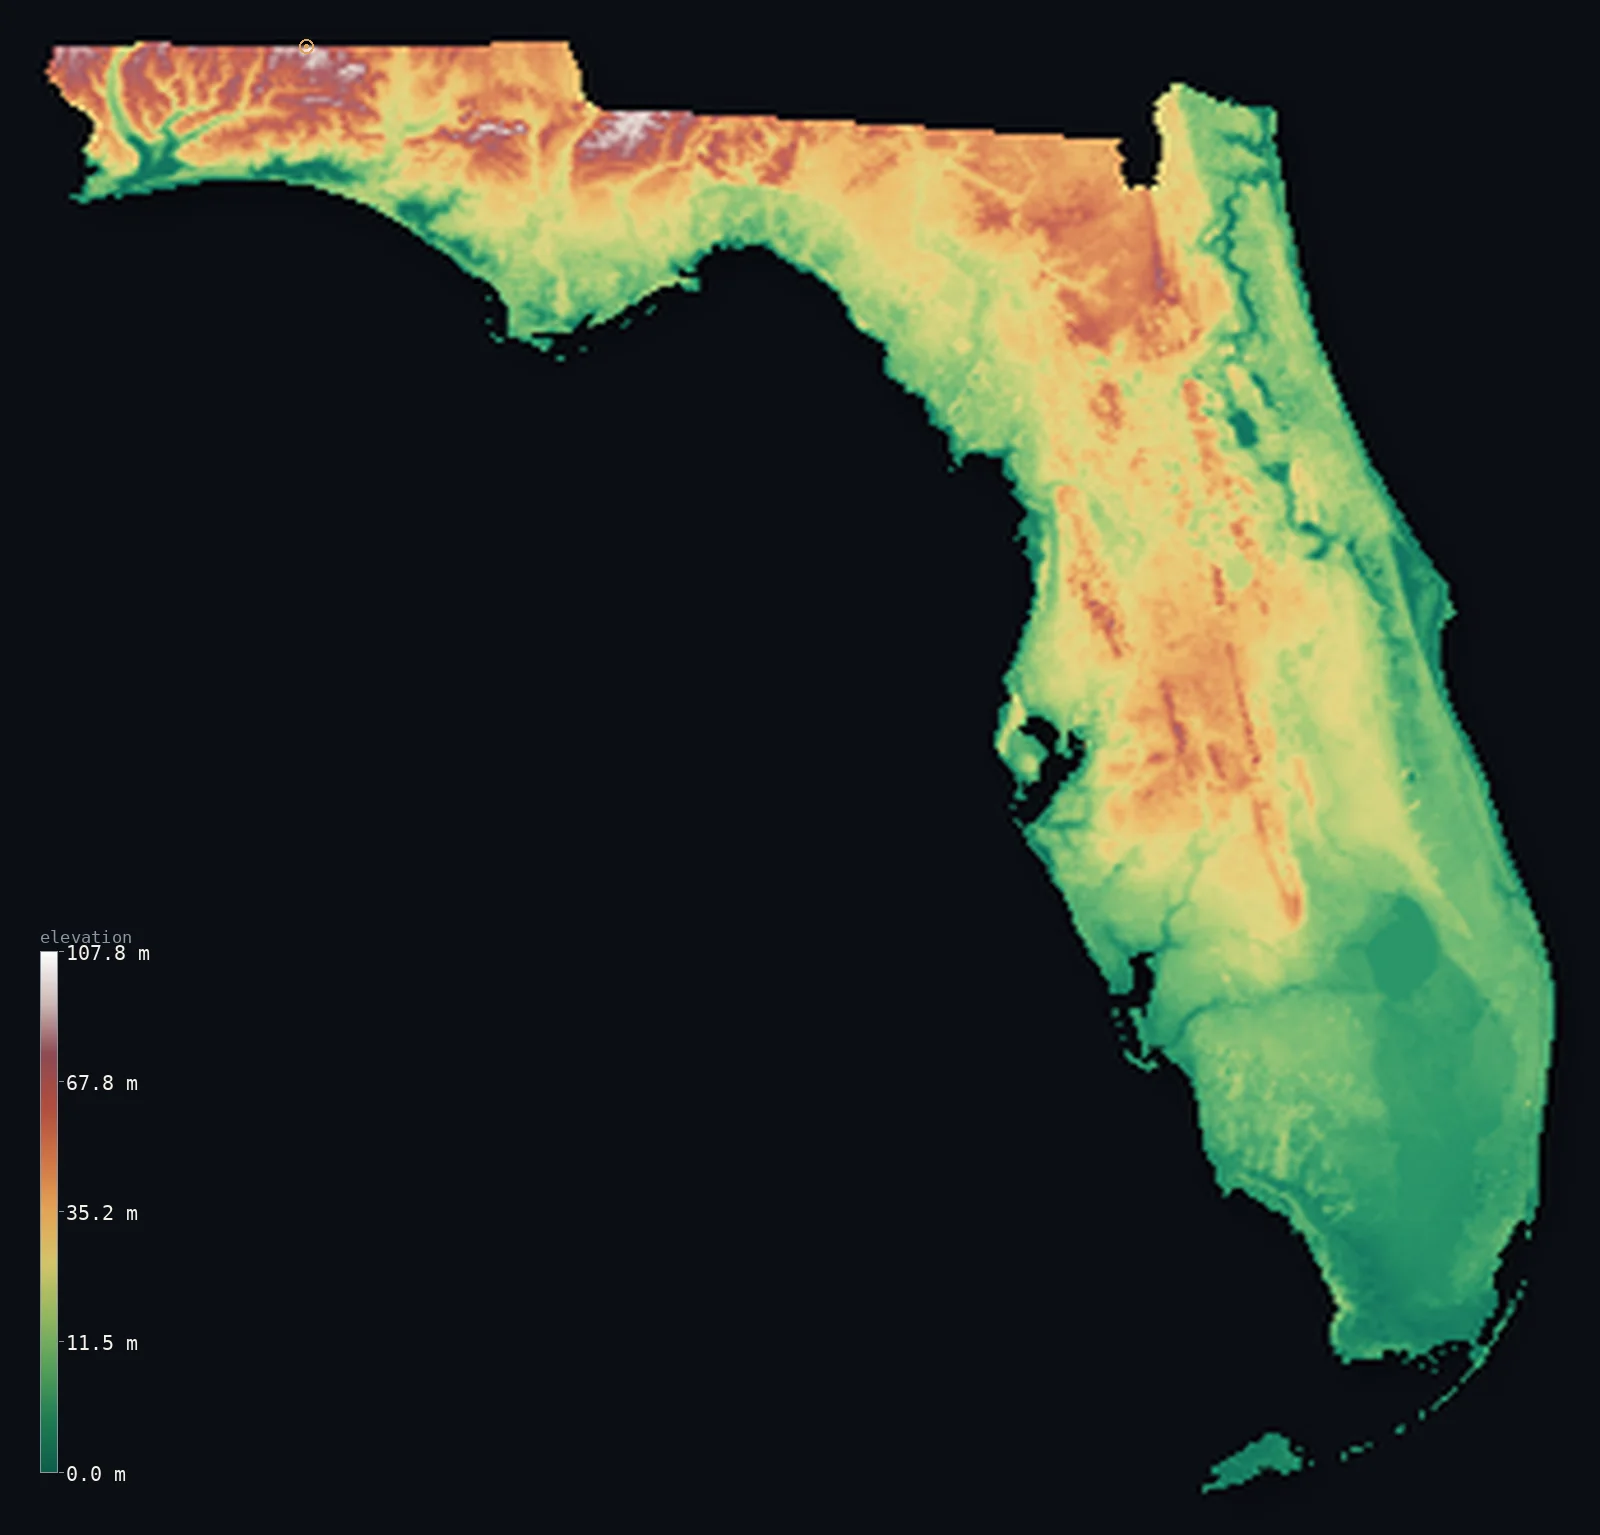
Highest point Britton Hill, 105 m
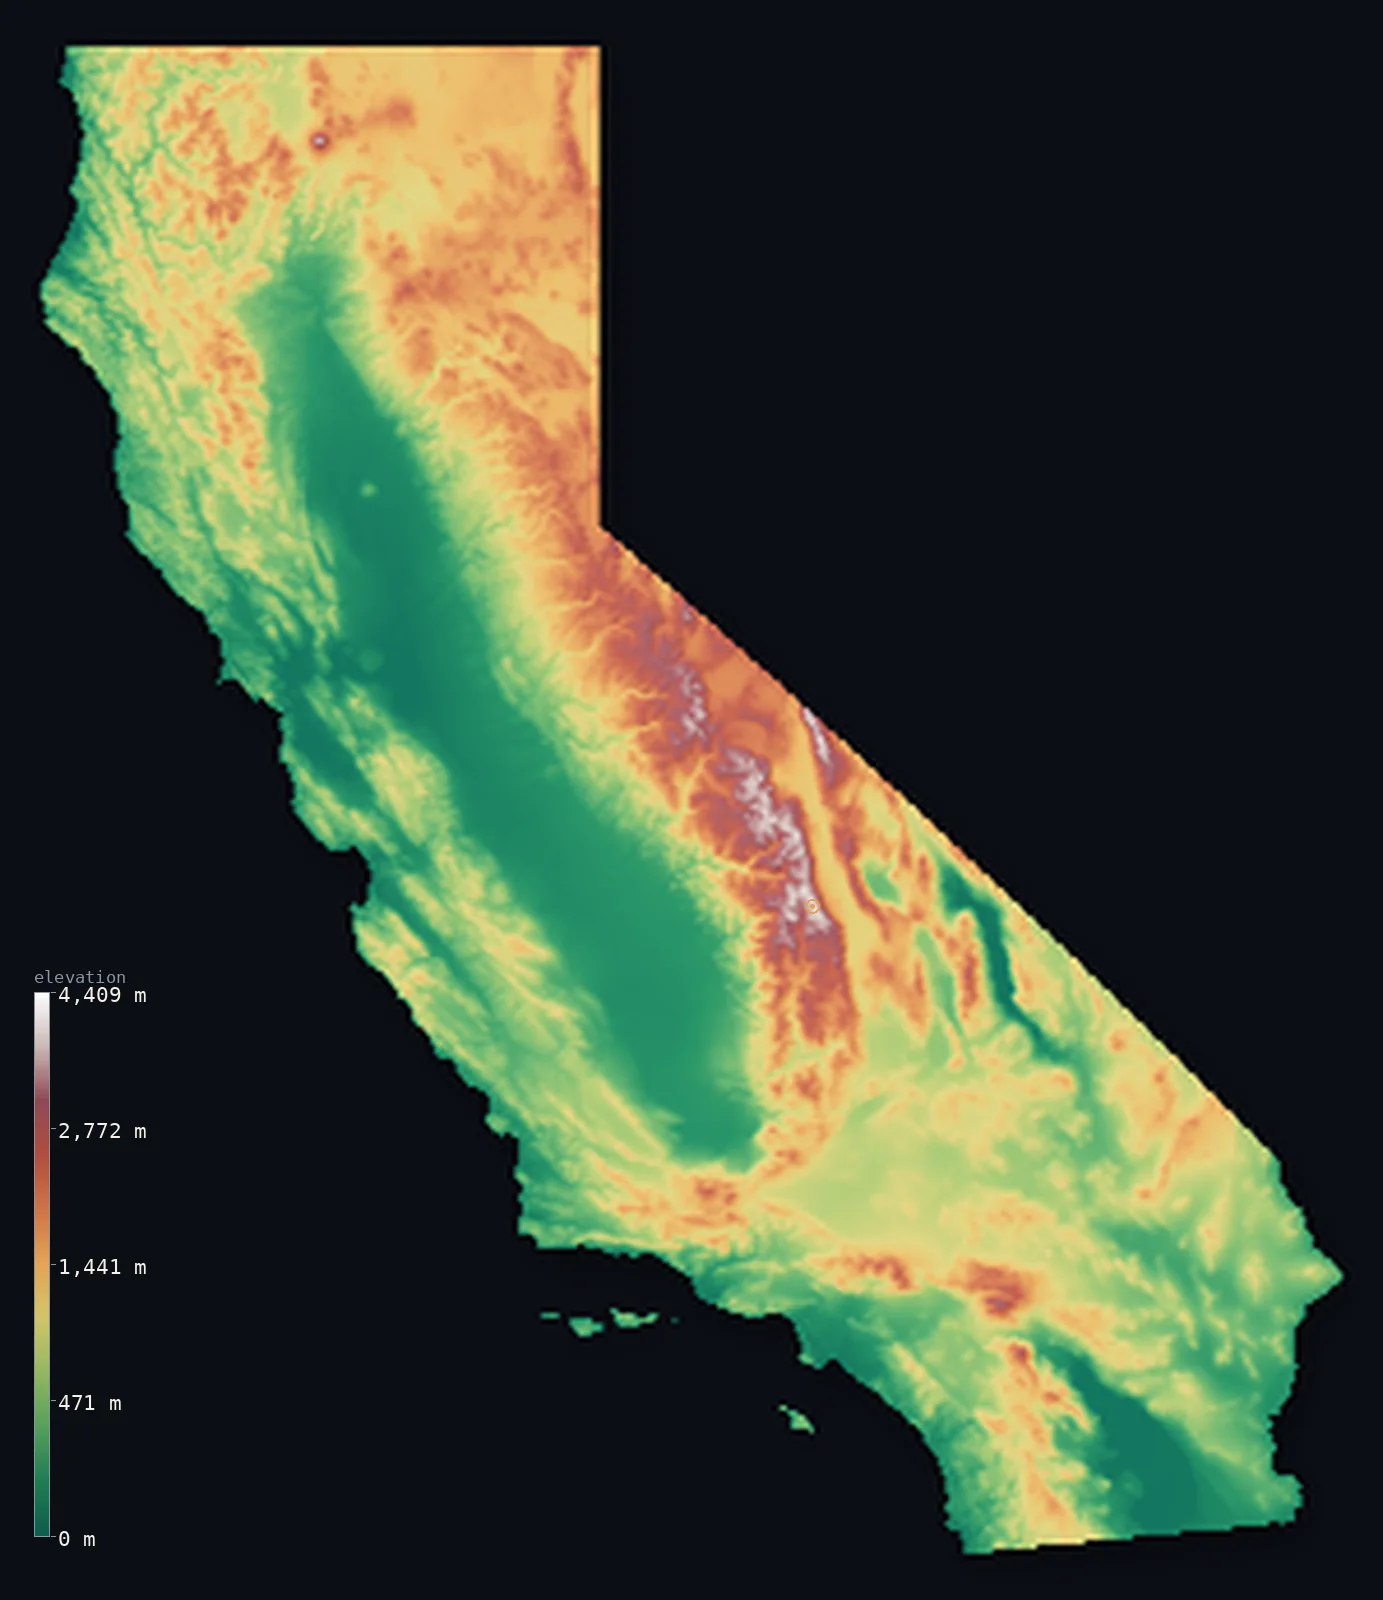
Highest point Mount Whitney, 4,421 m
Every US state
- Alabama
- Alaska
- Arizona
- Arkansas
- California
- Colorado
- Connecticut
- Delaware
- Florida
- Georgia
- Hawaii
- Idaho
- Illinois
- Indiana
- Iowa
- Kansas
- Kentucky
- Louisiana
- Maine
- Maryland
- Massachusetts
- Michigan
- Minnesota
- Mississippi
- Missouri
- Montana
- Nebraska
- Nevada
- New Hampshire
- New Jersey
- New Mexico
- New York
- North Carolina
- North Dakota
- Ohio
- Oklahoma
- Oregon
- Pennsylvania
- Rhode Island
- South Carolina
- South Dakota
- Tennessee
- Texas
- Utah
- Vermont
- Virginia
- Washington
- West Virginia
- Wisconsin
- Wyoming
Methodology
How these maps are made
Every map starts from the Copernicus GLO-30 digital elevation model — the European Space Agency’s global surface model, which records the height of the ground about every 30 metres. Each territory is cut to its official outline using geoBoundaries data, and every figure on its page — mean, median, range, and the share of area above each threshold — is computed directly from that masked grid of heights, not copied from another source.
Highest points get extra care. A coarse grid averages a sharp summit downward, so we re-read the model at its native ~30 metre resolution around each candidate peak and check the result against a researched, source-cited value. A page is published only once its data passes that validation.
The 3D view uses vertical exaggeration: height is scaled up relative to width so the relief is legible, because a country is hundreds of kilometres across but only a few kilometres tall, and at true scale even mountains look almost flat. The elevation numbers themselves are always the real, unexaggerated values. GLO-30 captures landforms rather than individual buildings or trees, and very small or very steep features can be smoothed — so treat these as terrain models accurate to the tens of metres, not surveying instruments.
Rendered from Copernicus GLO-30 (ESA); boundaries from geoBoundaries. Every figure traces to the elevation model or a sourced dossier.